For a paper I’m currently working on, I’m dealing with several types of Gaussian distributions that signal to onset and decay of an event. Events can have a slow onset and slow decay, resulting in a wide distribution, or they can have a fast onset and slow decay or vice versa. I’m exploring different ways to compare these distributions.
- comparing the entropy of the distribution, which gives a general statistic
- comparing the (linear) slopes of either side of distribution
- calculating the skewness and kurtosis of the distributions.
I was wondering if others had pointers and possible feedback on the proposed methods.
Dear Melvin,
This seems to amount to the question as to whether two (gaussian) probability distributions are equal. Two statistical tests for this purpose are the Wald-Wolfowitz test and Kolmogorov-Smirnov test. The latter is less (statistically) powerful but also more robust and you can compare any two distributions, also non-gaussian ones.
Another approach is “mixture modeling”, where you model the data as a mixture of 1 gaussian, or a mixture of k gaussians, and then compare these models (for an example see my R scripts linked below; from Nooteboom & Quené, 2020). * But the question in our article (have the data at hand been produced by one or two gaussian processes) may not be the question you wish to answer.
Hope this helps! Best wishes, Hugo Quené
- Models are compared by using their likelihoods (Likelihood Ratio Test), this may be somewhat equivalent to comparing their entropies?
–
KS test:
https://www.itl.nist.gov/div898/handbook/eda/section3/eda35g.htm
mixture modeling:
… link to supplementary materials at OSF … analyses folder …
in Rmd or html files, search for “histogram” or “mixture” or “mclust”
(apologies: only 2 links allowed here)
4 Likes
Could you show an example of this?
Thanks, Hugo, this is quite helpful. I think the likelihood ratio test might be applicable in my case. I’m working on the material this week, so more updates to come.
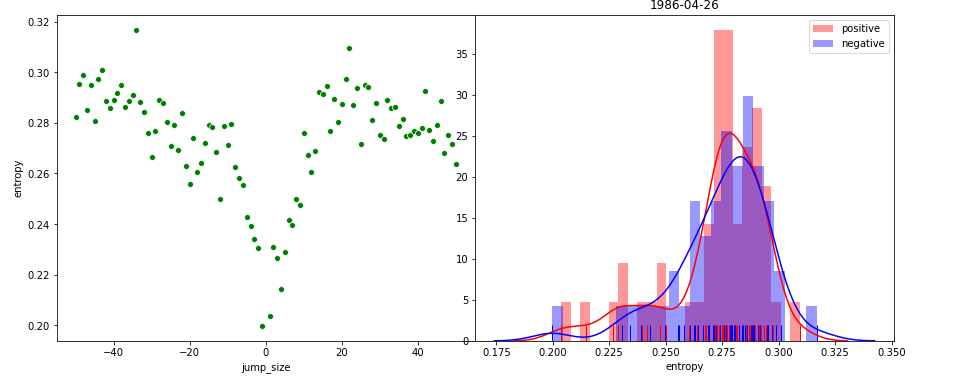
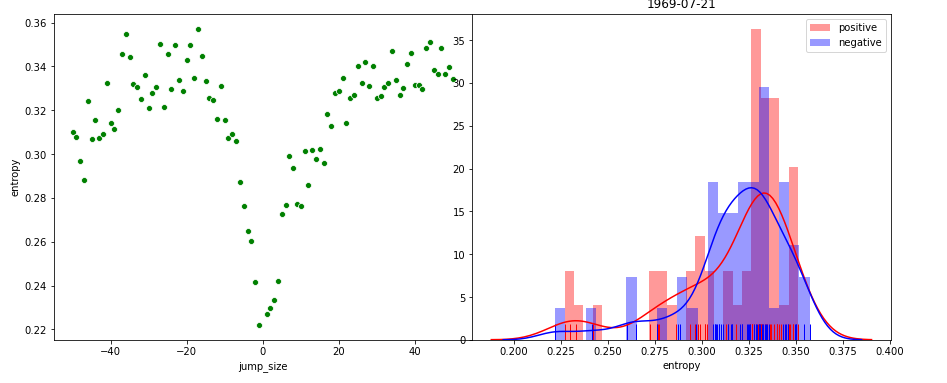
Here’s two examples. On the left of the plot, you see the difference expressed in entropy in newspapers on a set date compare to x dates in the past (negative jump size) or future (positive jump size). Dates close to the events are quite similar, and then the news reverts back to other stuff.
I’m examining this process between newspapers and events.
On the right you see the distribution of the entropy values for positive and negative jumps. This allows me to calculate whether the slope actually differs (using, for example, the two-sample KS-test that @hquene mentioned. I do think I have to mean center the distributions, as it’s not so much about the value of the entropy but the shape of the distributions).
In a way, I think I can compare these distributions using a mixture model as a change point detection to figure out when ‘events’ happened.